

Runtime Monitoring
In a microservice system, we need continuous visibility into system and service metrics, and alerts when problems occur. Therefore, a monitoring system is essential for microservices.
The Ubases IoT cloud platform uses a microservice backend architecture, so real-time monitoring of platform status is also essential. The IoT cloud platform integrates Prometheus, one of the most popular monitoring tools. Below is a brief introduction to Prometheus features, components, deployment, and usage.
Prometheus
Prometheus was originally created at SoundCloud as an open-source monitoring and alerting toolkit. Since 2012, it has been adopted by many companies and organizations and has developed an active community. Prometheus joined the Cloud Native Computing Foundation in 2016 as its second hosted project after Kubernetes.
Features
Compared with other monitoring tools, Prometheus has the following characteristics:
· Multidimensional data: Prometheus is a time series database with a multidimensional data model identified by metric names and key-value pairs.
· Powerful querying: PromQL allows you to slice and dice collected time series data to produce ad-hoc graphs, tables, and alerts.
· Excellent visualization: Prometheus supports multiple visualization modes: a built-in expression browser, Grafana integration, and console template language.
· Efficient storage: Prometheus stores time-series data in an efficient local time-series database. Larger deployments can scale through approaches such as functional sharding, federation, or compatible long-term storage systems.
· Simple deployment: Each server is independent for reliability and depends only on local storage. All binaries written in Go are statically linked and easy to deploy.
· Precise alerting: Alerts are defined with flexible PromQL and retain dimensional information. The Alertmanager handles notifications and silencing.
· Many client libraries: Client libraries make it easy to instrument services. More than ten languages are already supported, and custom libraries are easy to implement.
· Many integrations: Existing Exporters bridge third-party data into Prometheus—for example system stats, Docker, HAProxy, StatsD, and JMX metrics.
· Supports discovering targets via service discovery or static configuration
· Pulls time series data from services over HTTP
· Supports metrics from short-lived batch jobs through Pushgateway. Applications should not push metrics directly to the Prometheus server.
Components
The Prometheus ecosystem includes multiple components, many of which are optional:
· Prometheus Server: scrapes metrics and stores time series data
· Client libraries: instrument application code and expose metrics
· Pushgateway: push gateway for short-lived jobs to push metrics
· Exporters: expose third-party or system metrics for scraping
· Alertmanager: routes, groups, silences, and delivers alerts
· various supporting tools
Most Prometheus components are written in Go and are easy to build and deploy as static binaries.
Architecture
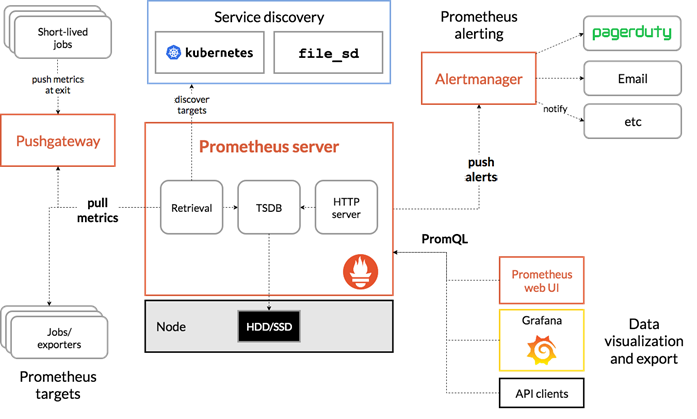
At intervals defined in its configuration, Prometheus scrapes metrics directly from targets. Metrics from supported short-lived batch jobs may be exposed through Pushgateway. Prometheus stores the collected time series and evaluates recording and alerting rules; Grafana or other tools can visualize the resulting data.
Deployment
To become familiar with the Prometheus workflow, first set up Prometheus and Grafana in a development environment, then use them to collect and display metrics.
ConfigMap
Prometheus starts with the configuration file prometheus.yml.
#  prometheus.yml
apiVersion: v1
kind: ConfigMap
metadata:
  name: prometheus-config
  namespace: observability
data:
  prometheus.yml: |
    global:
      scrape_interval: 15s
      scrape_timeout: 15s
    rule_files:
      # - "first.rules"
      # - "second.rules"
    scrape_configs:
    - job_name: 'prometheus'
      static_configs:
      - targets: ['localhost:9090']
A basic configuration file includes the following three modules:
· global: global configuration
· scrape_interval: how often to scrape metrics; default is 15s.
· scrape_timeout: the maximum time allowed for a scrape request. It is set to 15s here and must not exceed scrape_interval.
· rule_files: location of rules that Prometheus loads to generate new time series or alerts; no rules are configured currently.
· scrape_configs: configure monitored resources.
· job: Prometheus scrapes target metrics over HTTP. Targets must expose a /metrics endpoint. Notably, Prometheus also exposes metrics for itself. So the default config has a single job named prometheus that scrapes Prometheus’s own time series (status and performance) via http://localhost:9090/metrics. Add other resources under this module as needed.
Deployment
Next, prepare the Prometheus Deployment file.
# deployment.yaml
apiVersion: apps/v1
kind: Deployment
metadata:
  name: prometheus
  namespace: observability
  labels:
    app: prometheus
spec:
  selector:
    matchLabels:
      app: prometheus
  template:
    metadata:
      labels:
        app: prometheus
    spec:
      serviceAccountName: prometheus
      containers:
        - image: prom/prometheus:v2.19.0
          name: prometheus
          command:
            - "/bin/prometheus"
          args:
            - "--config.file=/etc/prometheus/prometheus.yml"
            - "--storage.tsdb.path=/prometheus"
            - "--storage.tsdb.retention=24h"
            - "--web.enable-admin-api" # Controls access to the admin HTTP API, including deleting time series
            - "--web.enable-lifecycle" # Supports hot reload; hit localhost:9090/-/reload to take effect immediately
          ports:
            - containerPort: 9090
              protocol: TCP
              name: http
          volumeMounts:
            - mountPath: "/prometheus"
              subPath: prometheus
              name: data
            - mountPath: "/etc/prometheus"
              name: config-volume
          resources:
            requests:
              memory: "1Gi"
              cpu: "100m"
            limits:
              memory: "2Gi"
              cpu: "200m"
      securityContext:
        runAsUser: 0
      volumes:
        - name: data
          emptyDir: {}
        - configMap:
            name: prometheus-config
          name: config-volume
rbac
Because Prometheus needs to access Kubernetes information, RBAC must also be configured.
# rbac.yaml
apiVersion: v1
kind: ServiceAccount
metadata:
  name: prometheus
  namespace: observability
---
apiVersion: rbac.authorization.k8s.io/v1
kind: ClusterRole
metadata:
  name: prometheus
rules:
  - apiGroups:
      - ""
    resources:
      - nodes
      - services
      - endpoints
      - pods
      - nodes/proxy
    verbs:
      - get
      - list
      - watch
  - apiGroups:
      - ""
    resources:
      - configmaps
      - nodes/metrics
    verbs:
      - get
  - nonResourceURLs:
      - /metrics
    verbs:
      - get
---
apiVersion: rbac.authorization.k8s.io/v1
kind: ClusterRoleBinding
metadata:
  name: prometheus
roleRef:
  apiGroup: rbac.authorization.k8s.io
  kind: ClusterRole
  name: prometheus
subjects:
  - kind: ServiceAccount
    name: prometheus
    namespace: observability
Service
To access the Prometheus service, create a Service as well.
Note: For easier testing, type is set to NodePort.
# service.yaml
apiVersion: v1
kind: Service
metadata:
  name: prometheus
  namespace: observability
  labels:
    app: prometheus
spec:
  selector:
    app: prometheus
  type: NodePort
  ports:
    - name: web
      port: 9090
      targetPort: http
Deploy
# Create the observability namespace for Prometheus deployment
$ kubectl create namespace observability
namespace/observability created

# Deploy all files

$ kubectl apply -f prometheus.yaml
configmap/prometheus-config created

$ kubectl apply -f rbac.yaml
serviceaccount/prometheus created
clusterrole.rbac.authorization.k8s.io/prometheus created
clusterrolebinding.rbac.authorization.k8s.io/prometheus created

$ kubectl apply -f deployment.yaml
deployment.apps/prometheus created

$ kubectl apply -f service.yaml
service/prometheus created
Web UI
Access
Get the service access port (31033)
$ kubectl get service -n observability
NAME         TYPE       CLUSTER-IP     EXTERNAL-IP   PORT(S)          AGE
prometheus   NodePort   10.98.133.13   <none>        9090:31033/TCP   44s
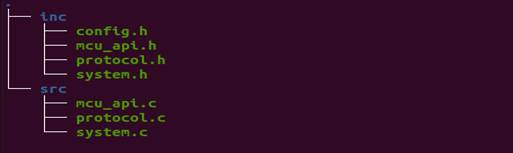
Then open http://localhost:31033 to access the Prometheus web UI.
View Metrics
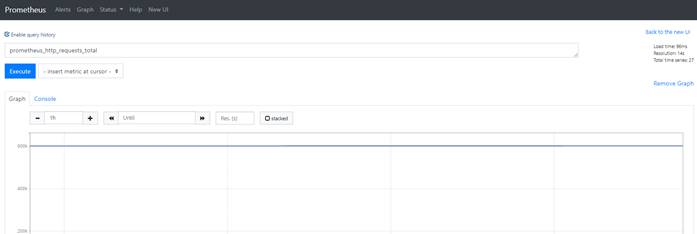
Enter and select prometheus_http_requests_total. Choose Graph, then click Execute to view metric prometheus_http_requests_total as a graph.
How did the prometheus_http_requests_total metric get into Prometheus?
Because the configuration monitors Prometheus itself, and Prometheus exposes /metrics on port 9090. You can visit http://localhost:9090/metrics to see the metrics. Since the service is exposed via NodePort, the access URL becomes http://localhost:31033/metrics.
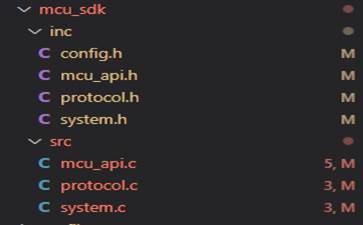
Here you can see that Prometheus /metrics includes prometheus_http_requests_total, so we can obtain that metric’s values.