

Data Visualization
Data Statistics
The dashboard shows cumulative metrics and real-time metrics for the current day. Use it to quickly understand key indicators for smart products, OEM Apps, devices, and end-user activity.

Cumulative Real-Time Overview
1. Cumulative device activations:
Total cumulative activated devices
Report shows activations for each of the past 12 months
2. Cumulative App users:
Total cumulative registered users across all Apps
Report shows registrations for each of the past 12 months
3. Cumulative device faults:
Total cumulative reported device faults
Report shows fault counts for each of the past 12 months
Today’s Real-Time Overview
1. Today’s device activations:
Number of devices activated today up to the current time
Report shows activations for each hour over 24 hours
2. Today’s App user registrations:
Number of App user registrations today up to the current time
Report shows registrations for each hour over 24 hours
3. Today’s device faults:
Number of reported device faults today up to the current time
Report shows fault counts by fault type up to the current time
Device Statistics
Device statistics cover activation, device activity, product data-point usage, and geographic distribution. These metrics show how many devices have been activated by consumers, which product functions are used most often, and where devices are located. Use the filters at the top of the page to view all countries, a product category, or an individual product.
Activation Data
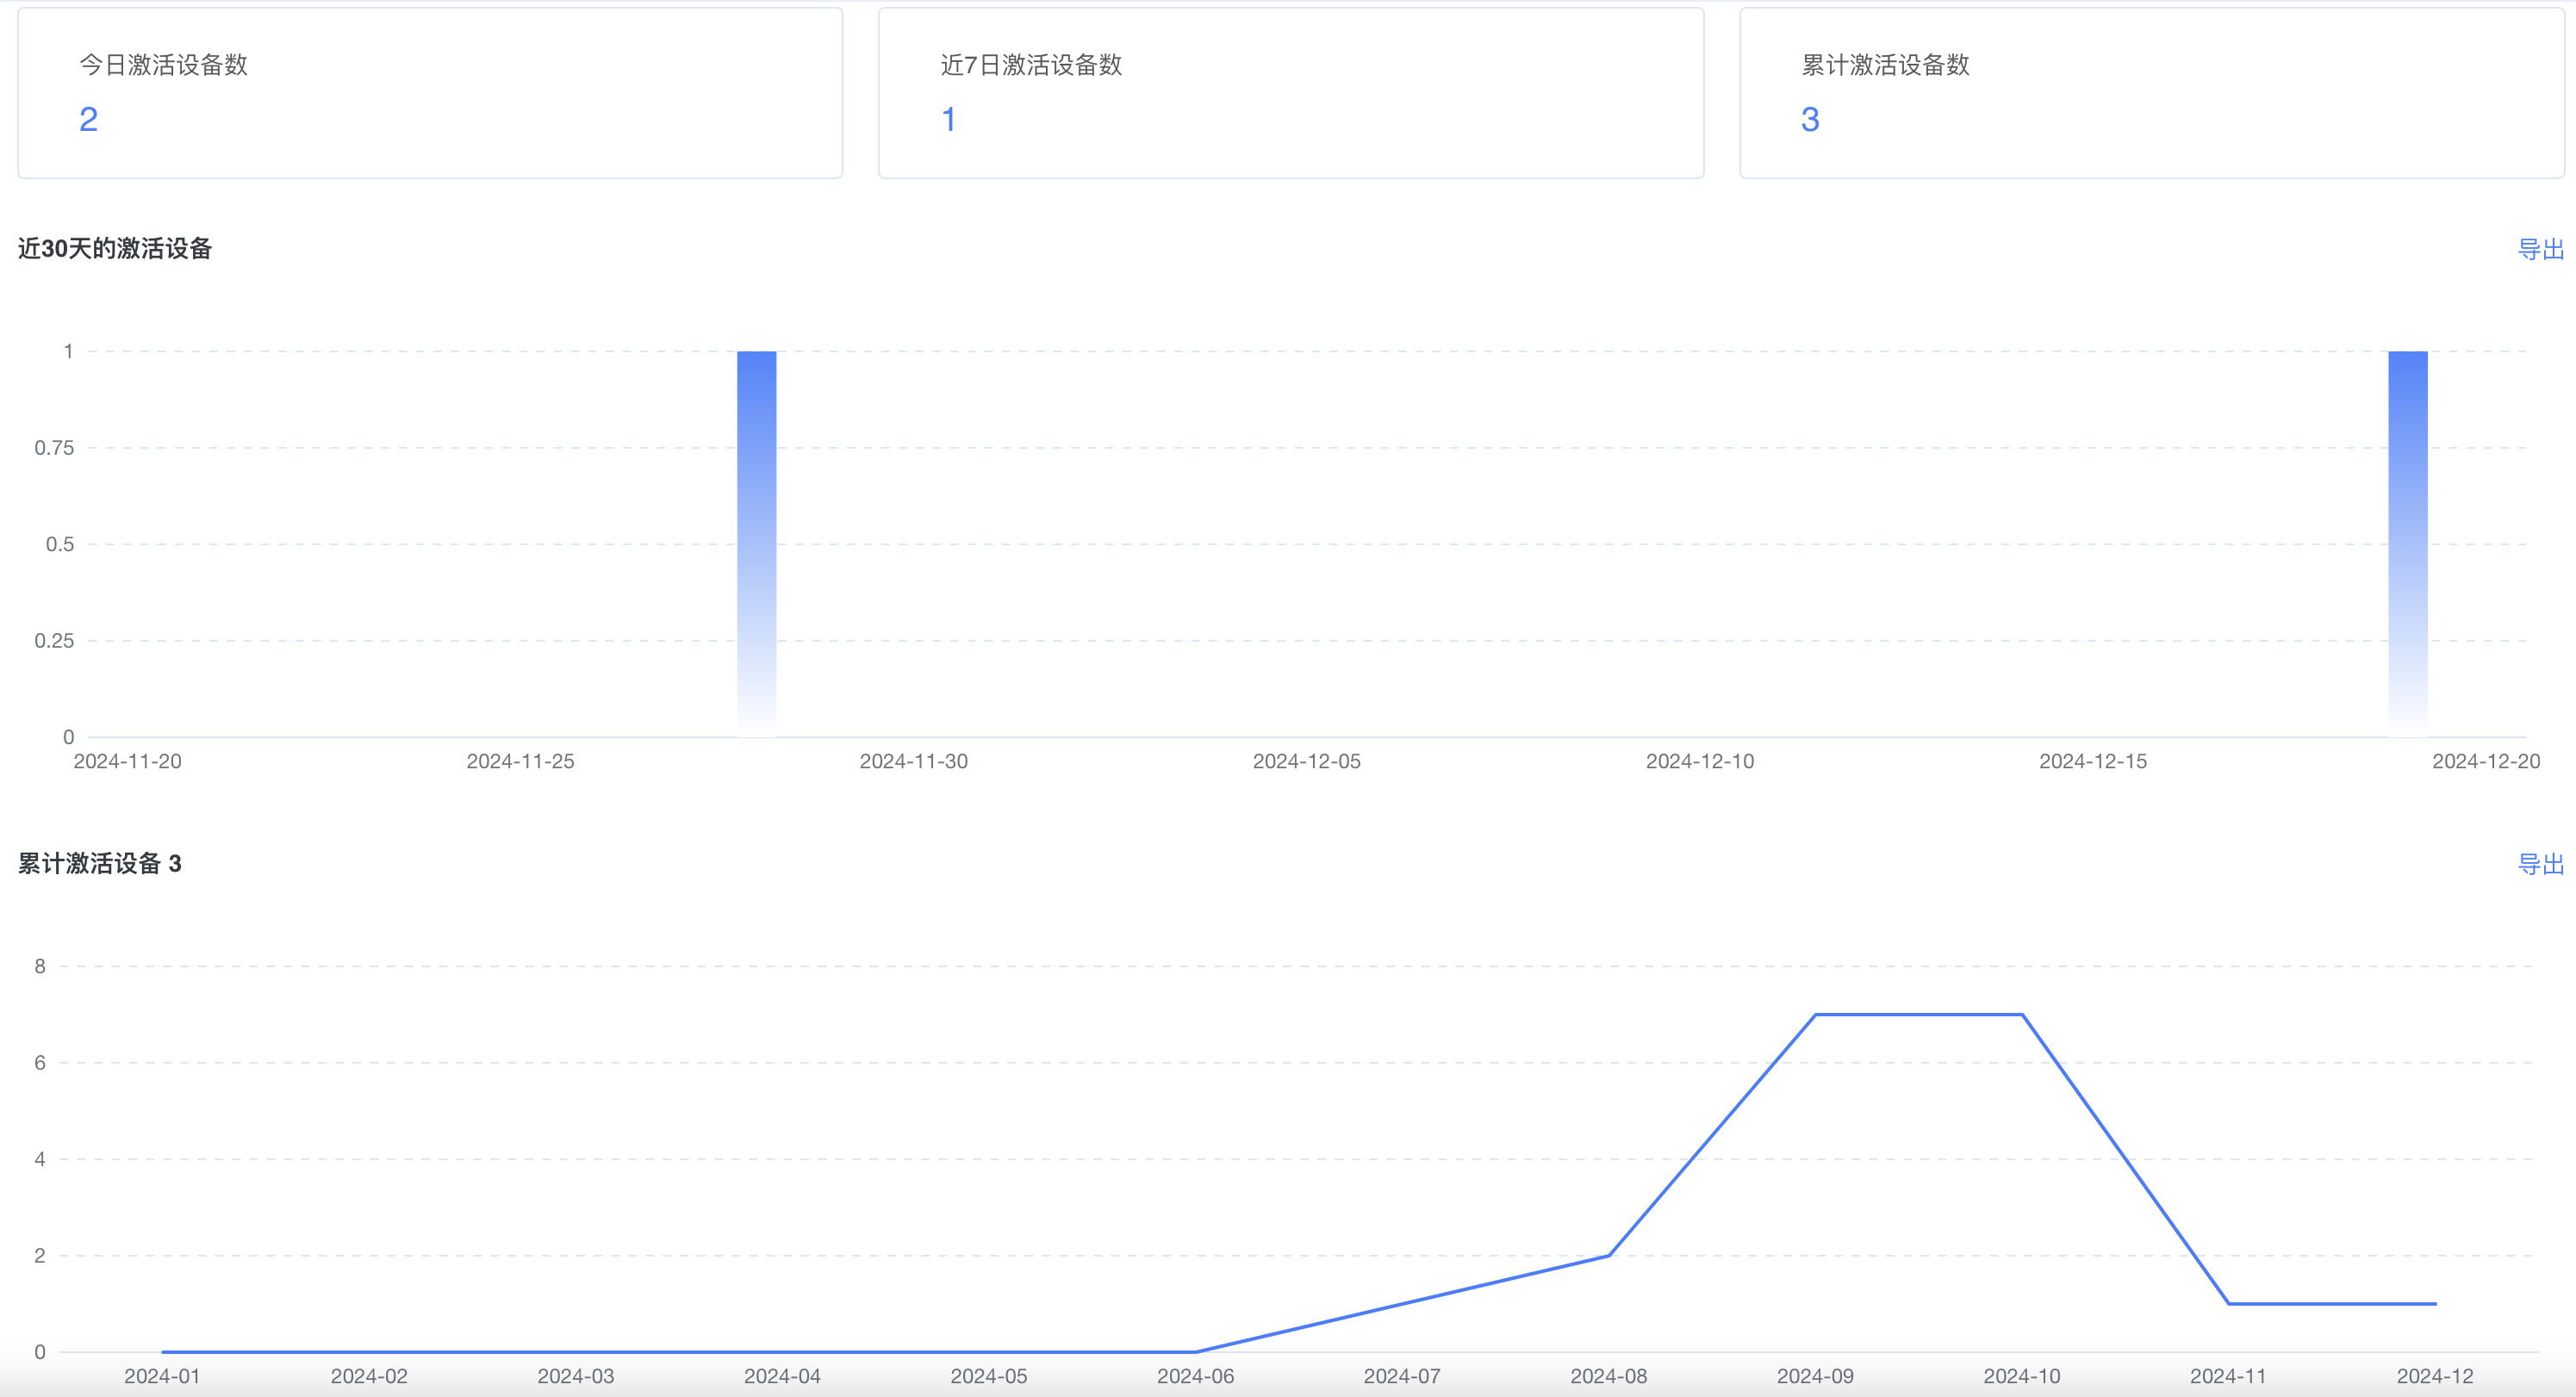
Devices activated today: Number of devices under the current account that were bound to the App for the first time through device provisioning today. Devices activated in the past 7 days: Number of devices under the current account that were bound for the first time during the previous seven days, excluding today. Cumulative activated devices: A device is counted as activated after it is successfully bound to the App for the first time through device provisioning. This metric totals activated devices associated with the PIDs under the current account.
Fault Statistics
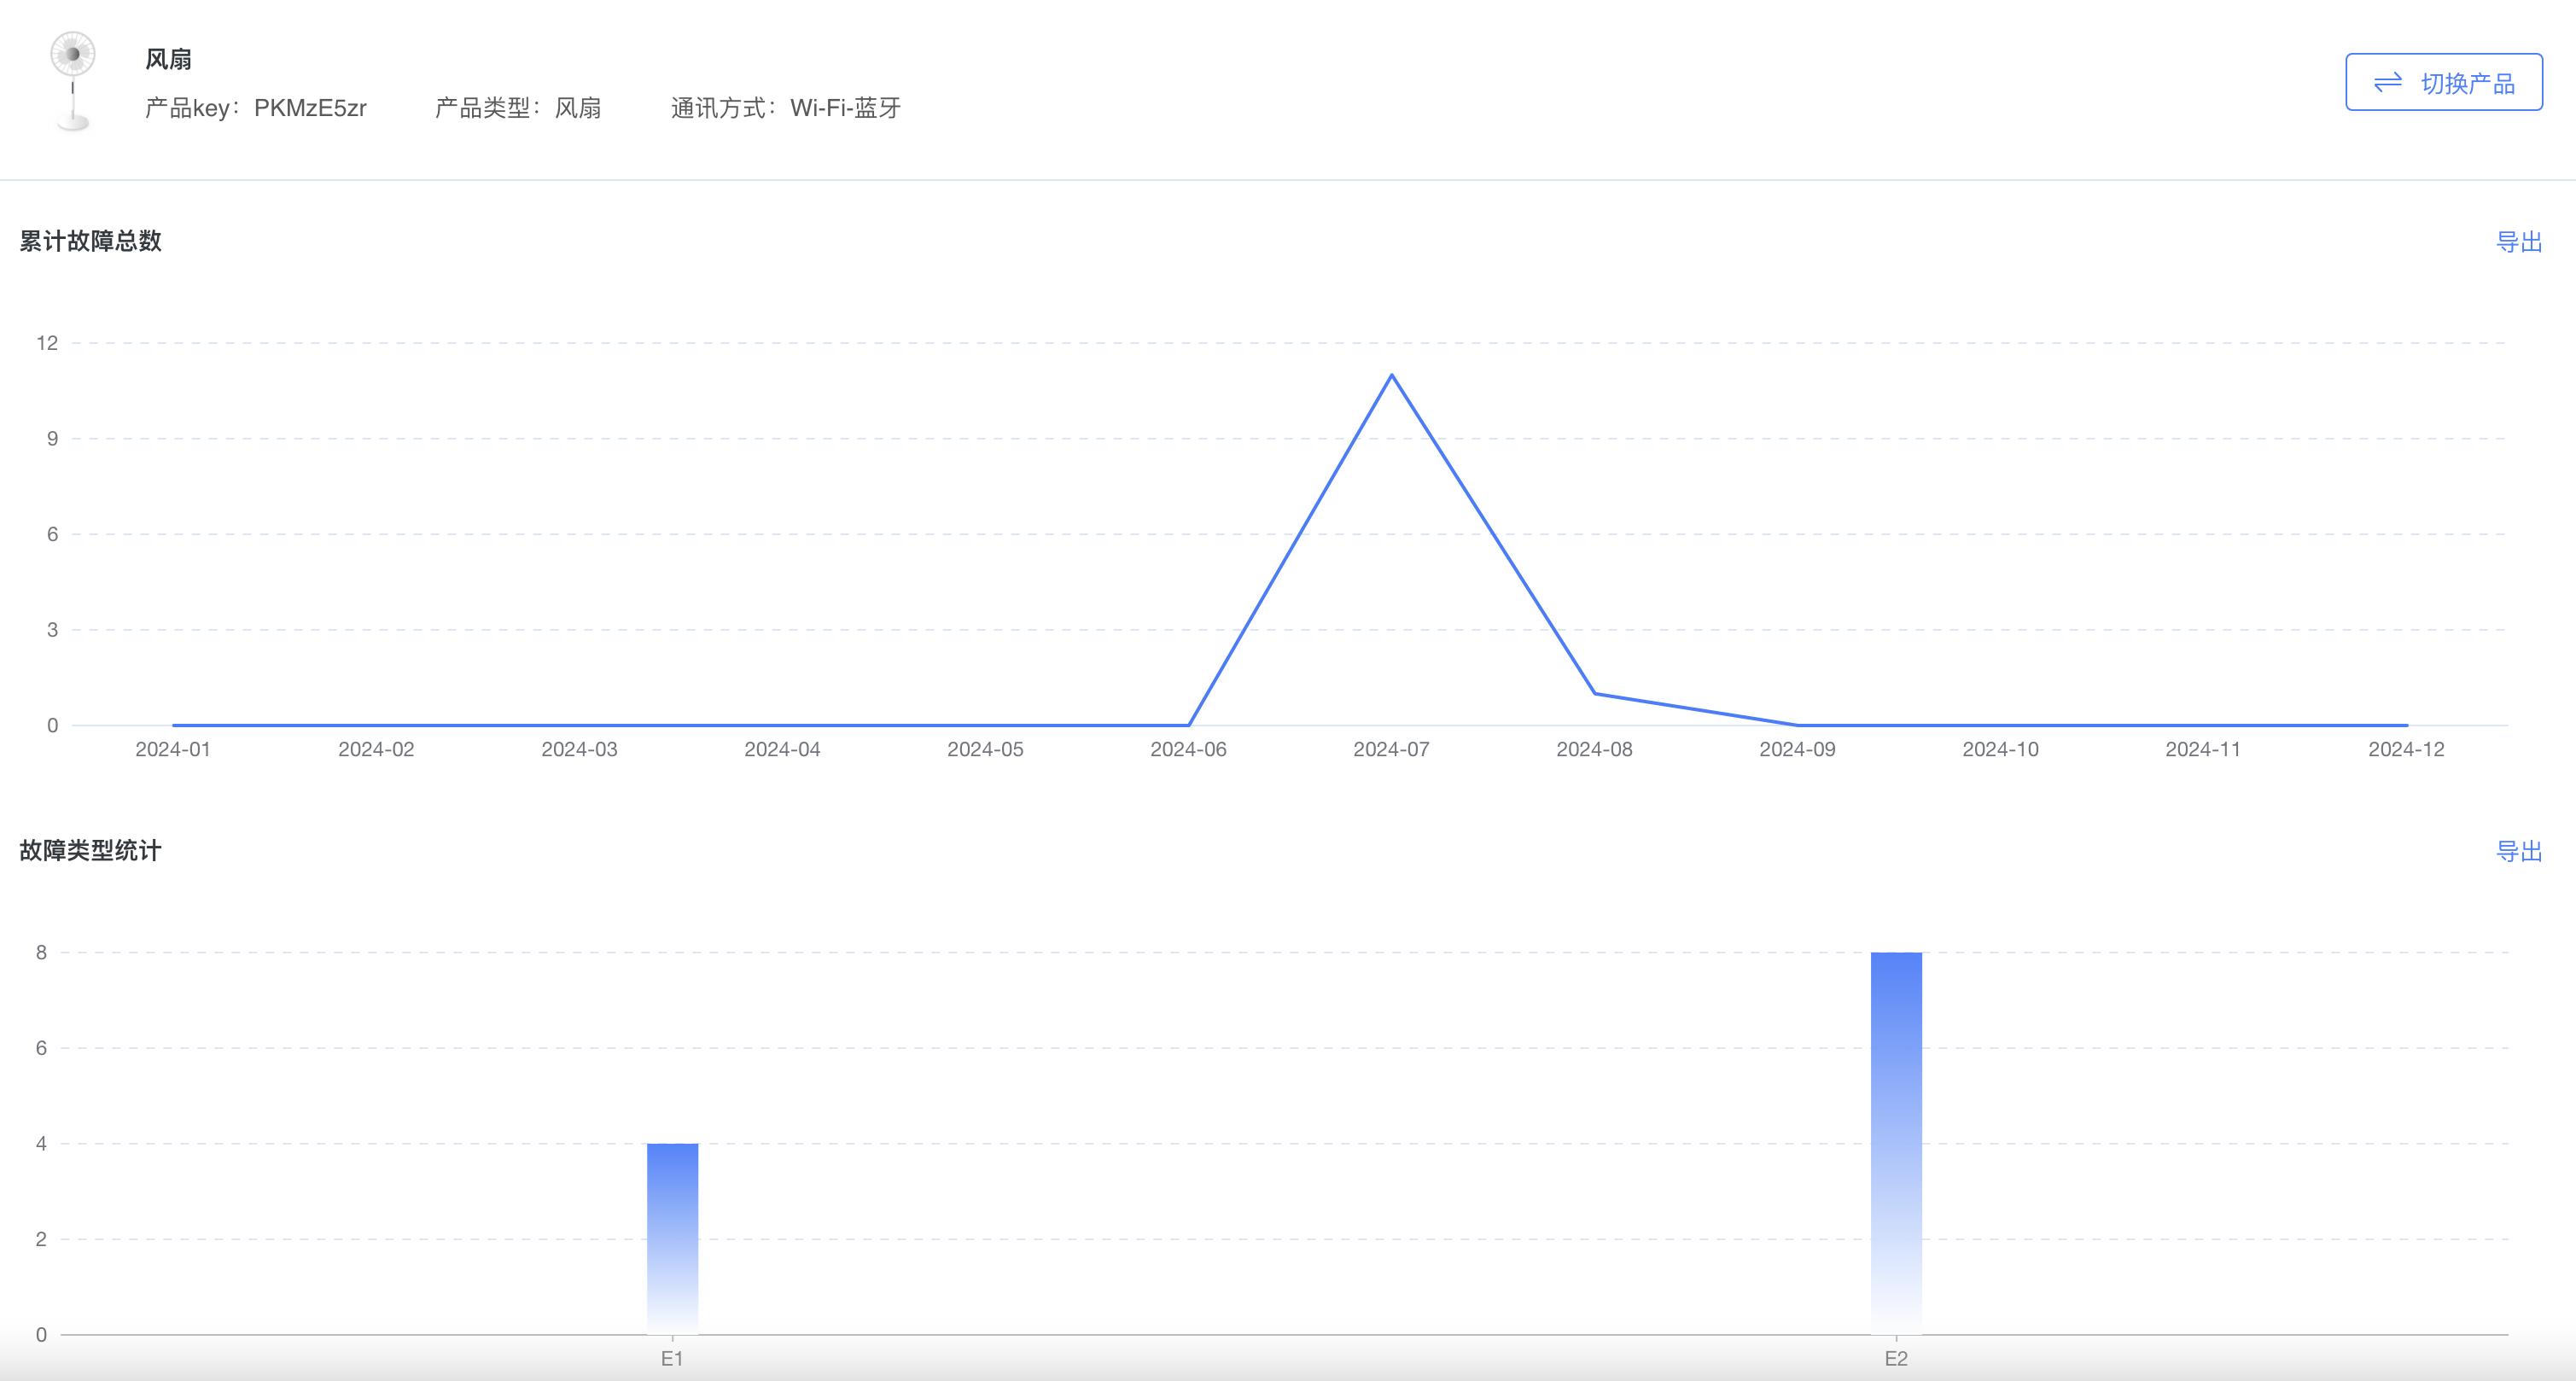
- Today’s faults: Number of faults reported today via fault DP function points for devices under this account; one device may report multiple times.
- Day-over-day fault ratio: today’s fault count divided by yesterday’s fault count.
- Total faults: Total faults reported on the statistics day for devices under the current account.
App User Statistics
App user analysis covers registered and active users, including registration trends, active-user trends and composition, engagement, and retention. Retention data is available only after enterprise verification. These metrics help you understand usage patterns, optimize the App, and plan operations and marketing campaigns. For example, if weekend usage is twice weekday usage, you may choose to schedule campaigns on weekends.
User Management
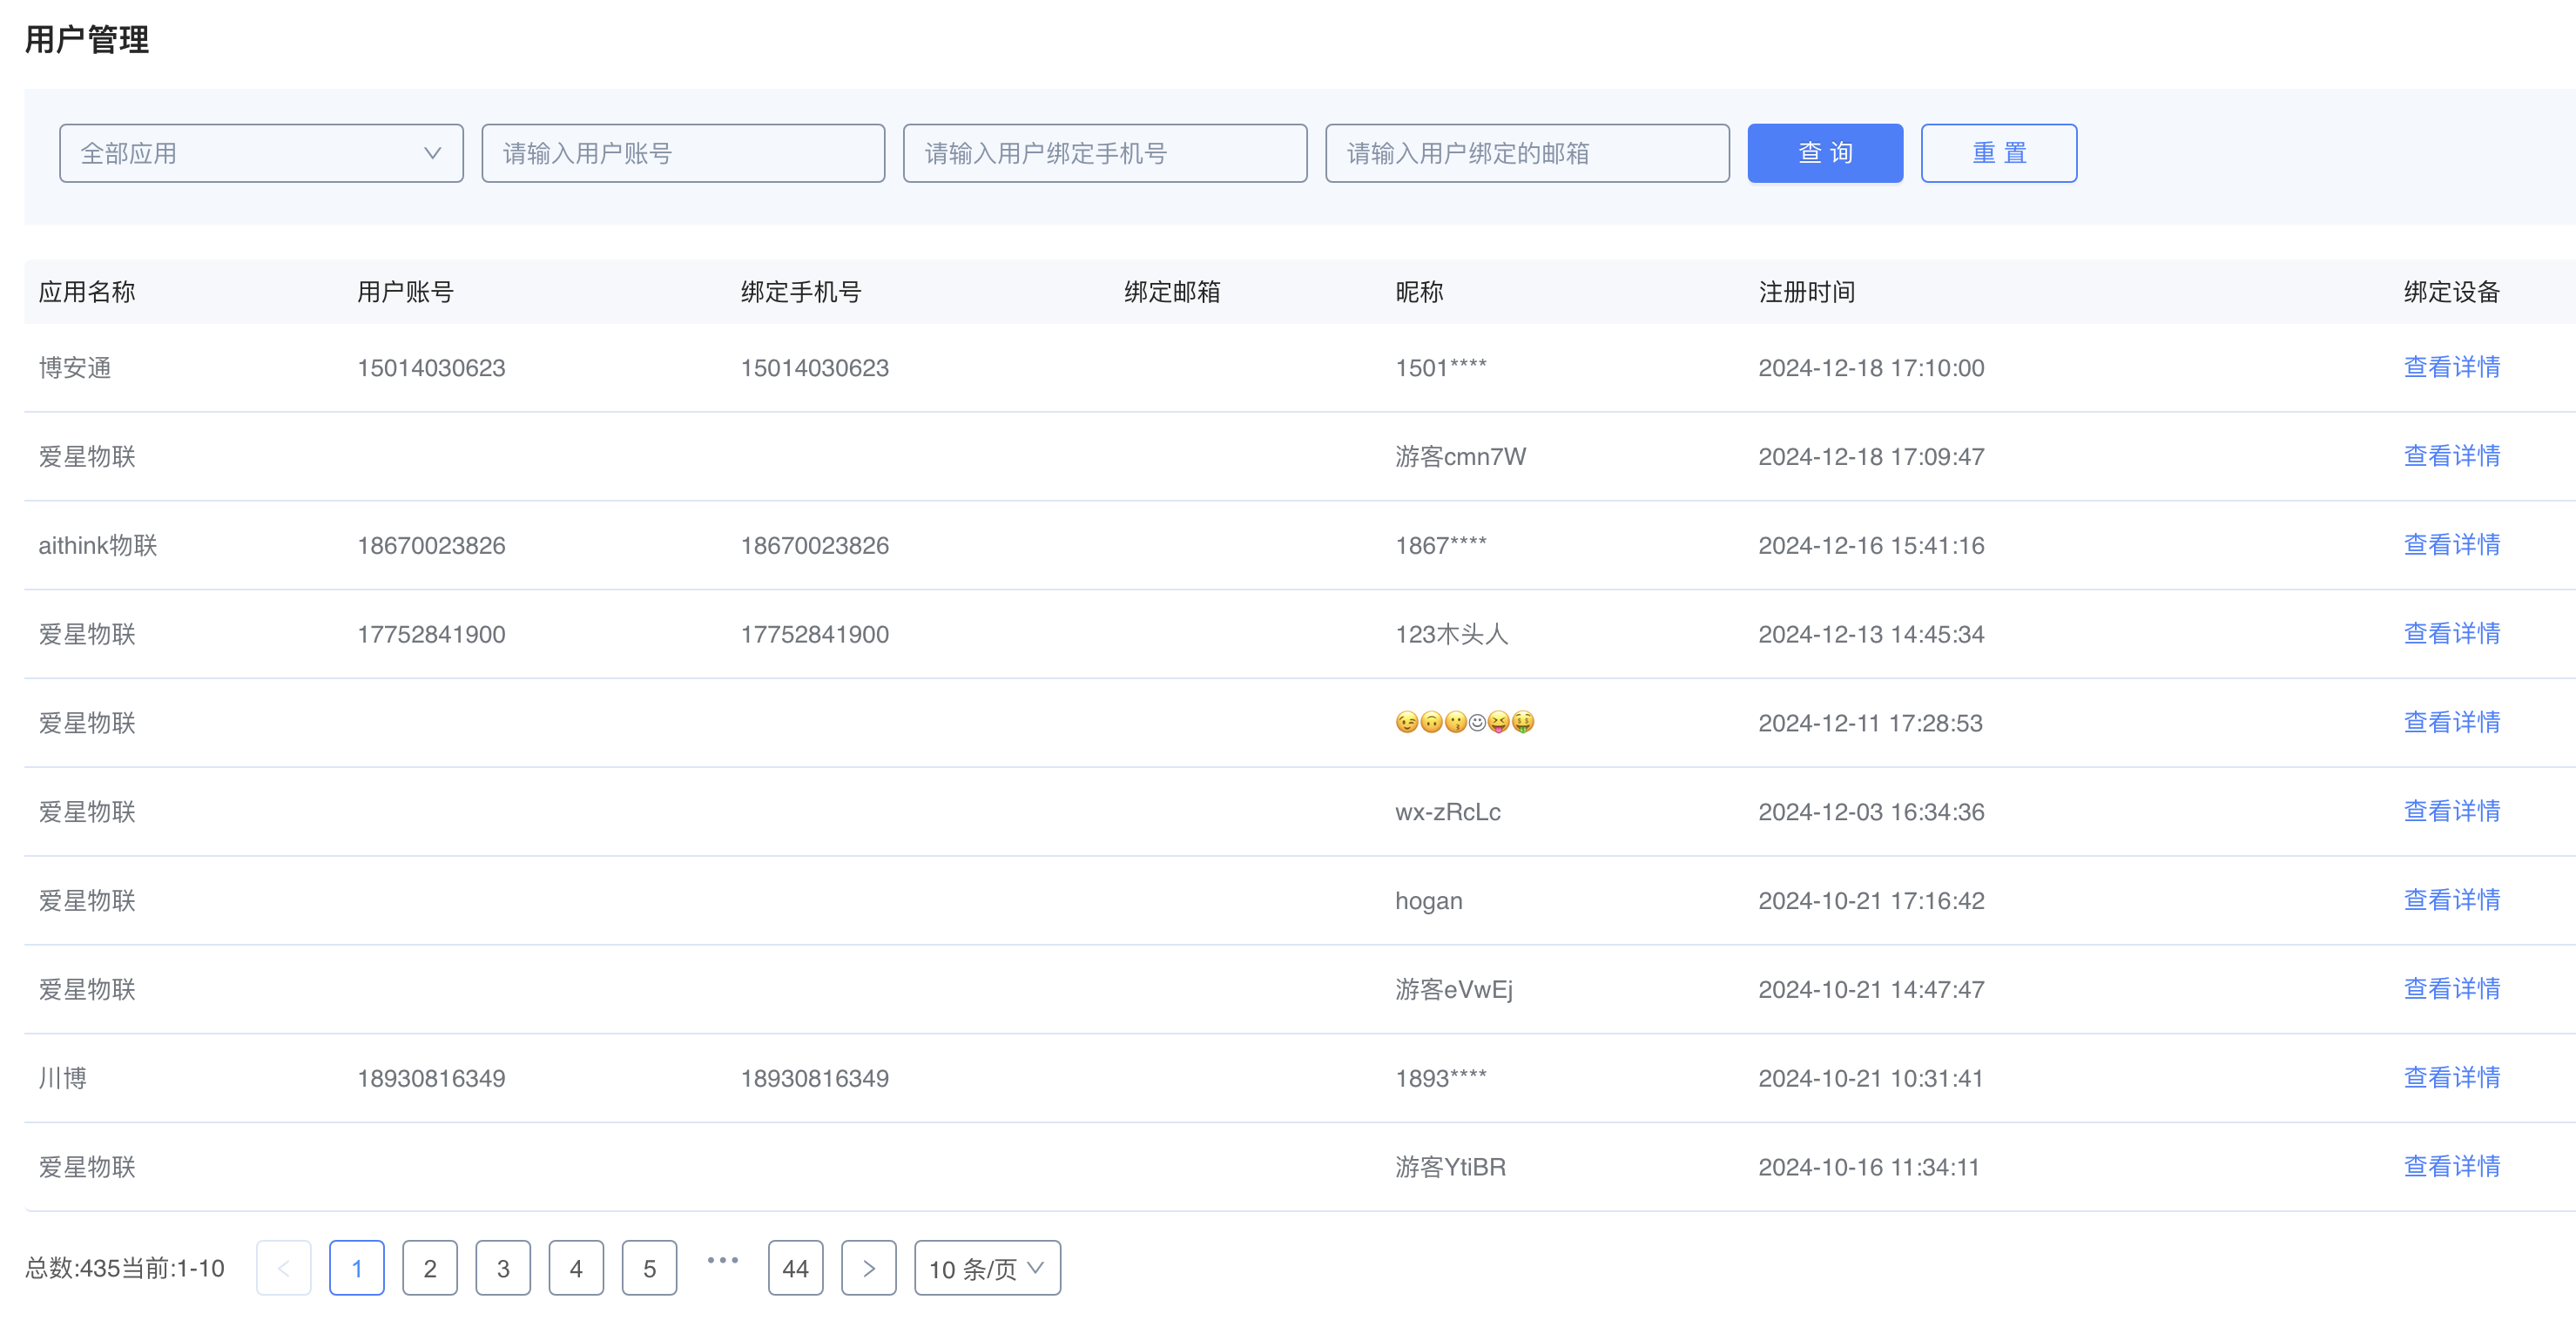
Shows registered user counts for all of the developer’s OEM Apps, plus user details
User Analysis
- Cumulative registered users: All registered users under the current App; the chart shows monthly registration volume for the past 12 months
- Active users in the past 30 days: Daily active users over the past 30 days (counted once per day when a user logs in and performs certain read/write actions; the same user is recorded only once per day)
