How to use J-Link to debug ESP32
How to use J-Link to debug ESP32
1. Install JLink driver
2. Connect the hardware
3. Configure libusb
Because there is no libusb under Windows, it needs to be solved from another way of thinking.
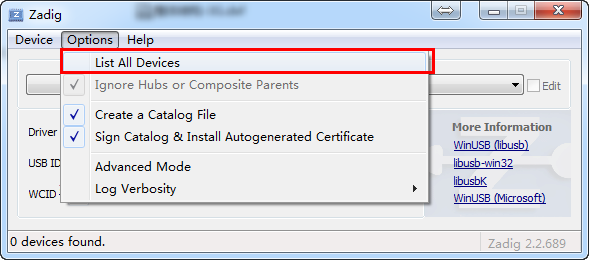
Download zadig_2.2.exe (update reminder will pop up, you can cancel), and check List All Devices as shown below
Find J-Link, change the right to WinUSB in the Driver column, click Install Driver or Replace Driver to install the WinUSB driver (otherwise the libusb function cannot be used), as shown below:
4. Configure OpenOCD
Refer to the Espressif documentation to download openocd-esp32, and copy esp-idf/docs/esp32.cfg to the openocd-esp32 folder (the changes I made are as follows)

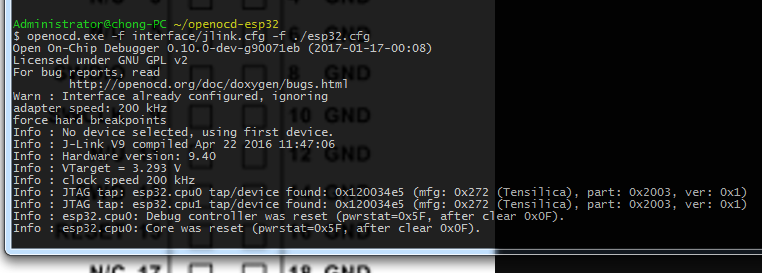
5. Connect J-Link
6. Use GDB
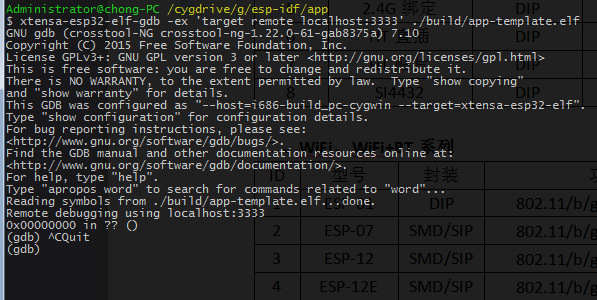
Execute xtensa-esp32-elf-gdb -ex'target remote localhost:3333' ./build/app-template.elf in the app directory to start debugging
Enter l (short for list) to view the source code directly
For other commands such as setting breakpoints, printing, and debugging, please search and learn by yourself. This article will not introduce them.


